Specialty Chemicals Batch Anomaly Monitoring
Chemicals
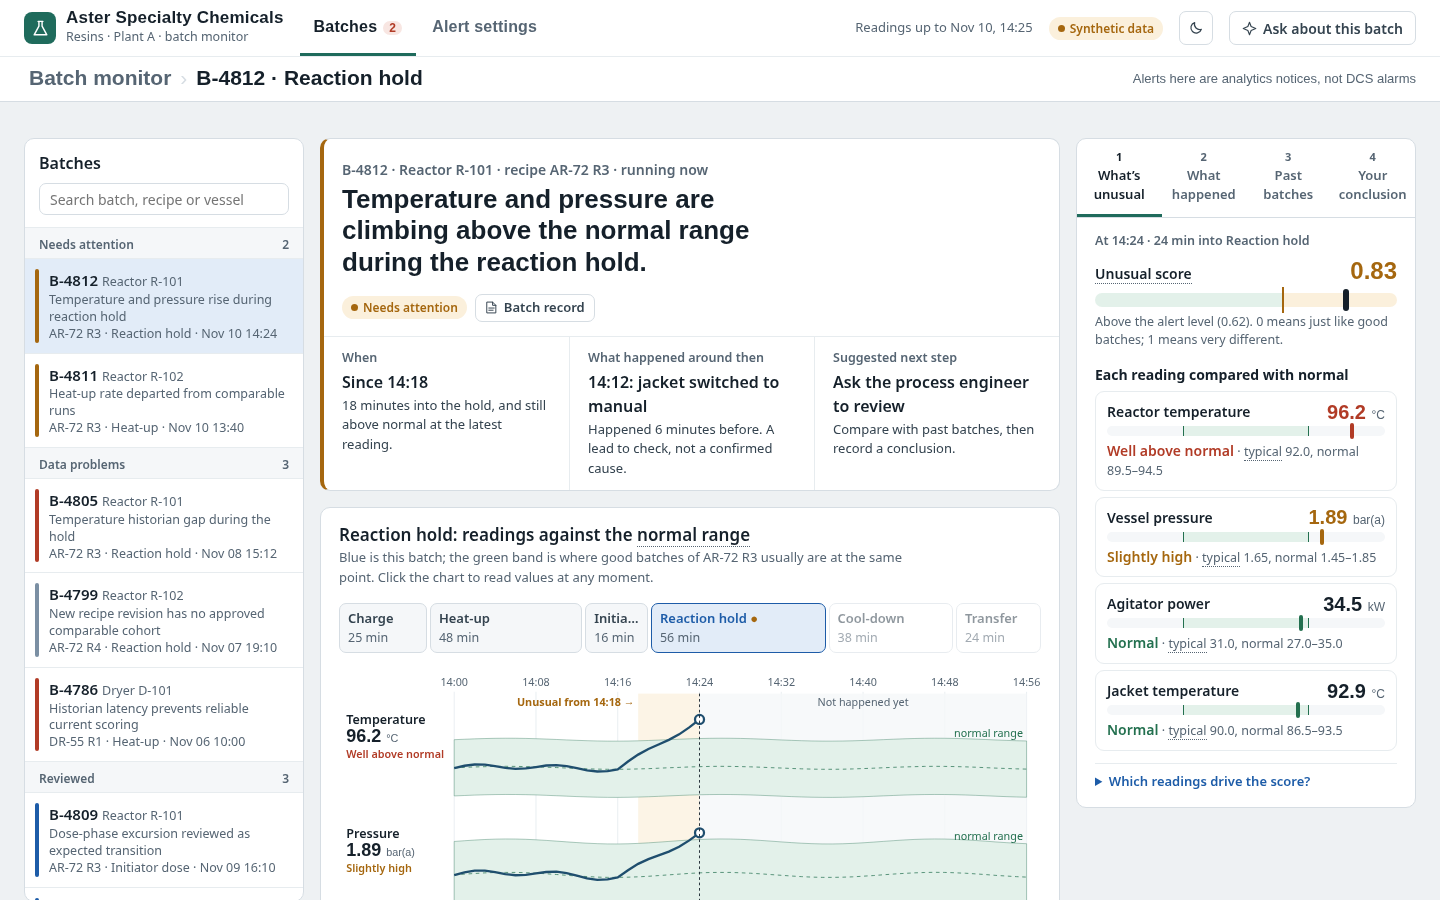
The question it answers
Which batches differ from accepted recipe runs, what evidence explains the timing, and how would candidate detector settings change alerts?
Specialty-chemical batch process deviations versus recipe phase baselines, historian signals and event context.
See how teams use this- Industry
- Chemicals
- System
- MES, run manufacturing
- Area
- Manufacturing Intelligence
- Module
- Predictive Analytics
- Parts
- 18 screens and components
What's inside
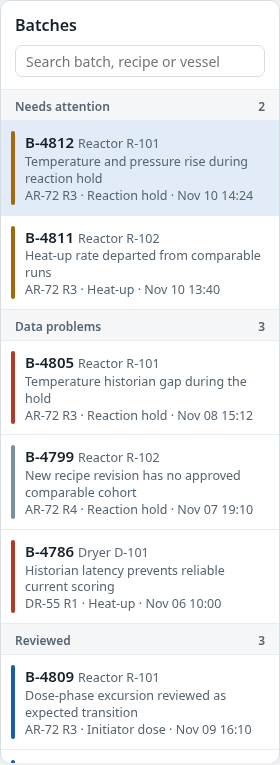 Batch selection and status queueBatches by attention status, with vessel and recipe context
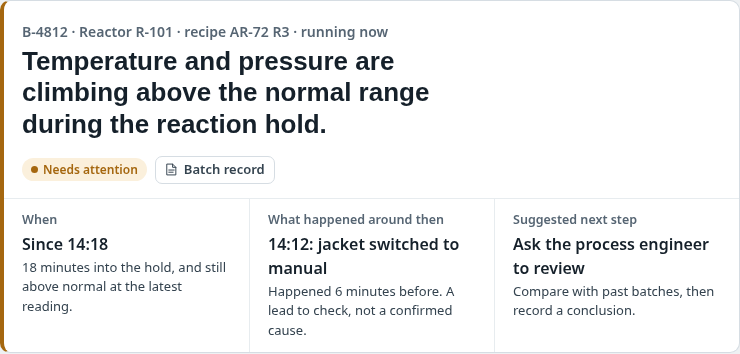 Selected batch issue summaryPlain-language issue, time context, correlated event and next investigation step
 Recipe phase navigationCharge, heat-up, dosing, reaction hold, cooling and transfer progression
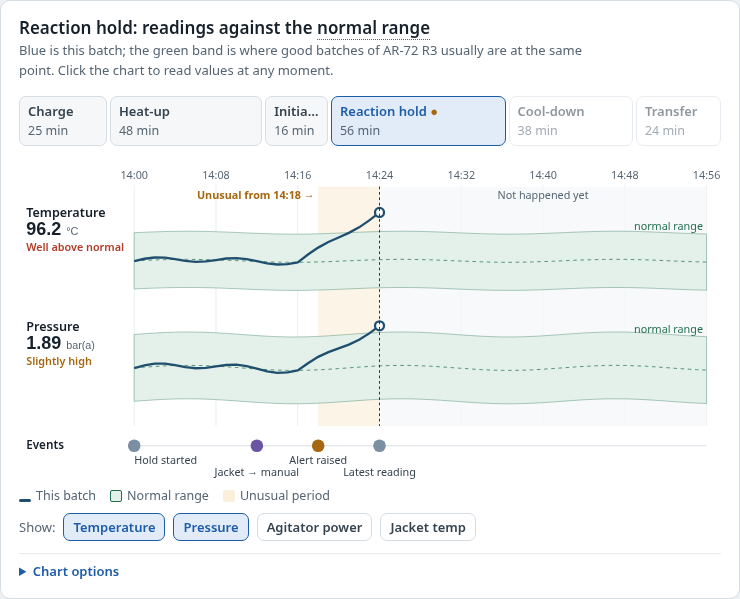 Process-signal comparison chartTime-aligned selected batch readings compared with matched accepted-run bands and event markers
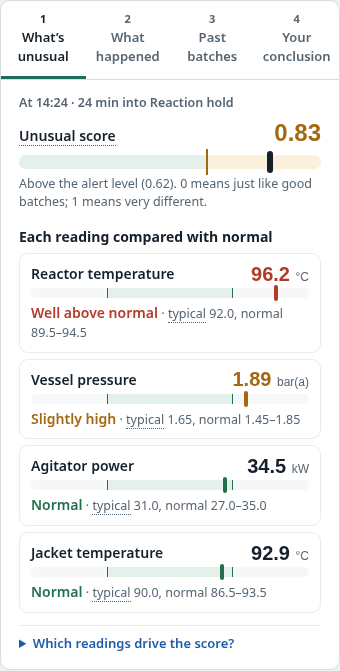 Deviation score and signal readingsCurrent multivariate unusual score, per-sensor deviation readings and cohort reference values
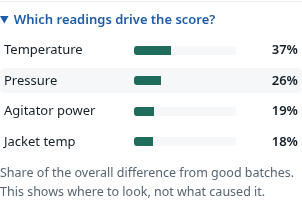 Model signal contributionsShows relative deviations that drive anomaly score without attributing causation
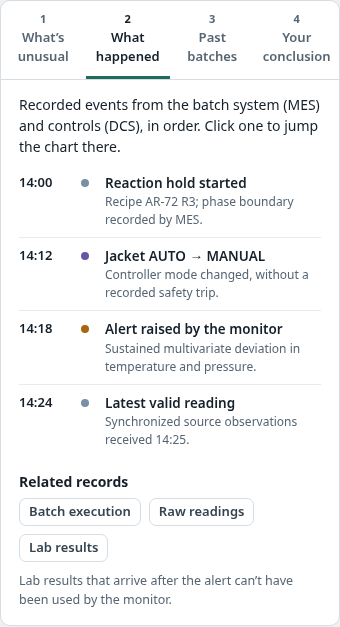 Recorded batch and control eventsMES and DCS event sequence explaining what changed around the deviation
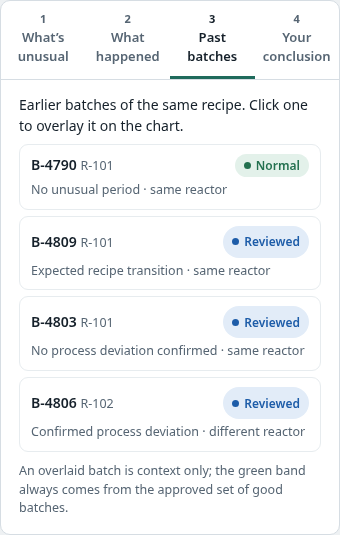 Comparable past batch selectionPast batch outcomes and optional waveform overlay on the process chart
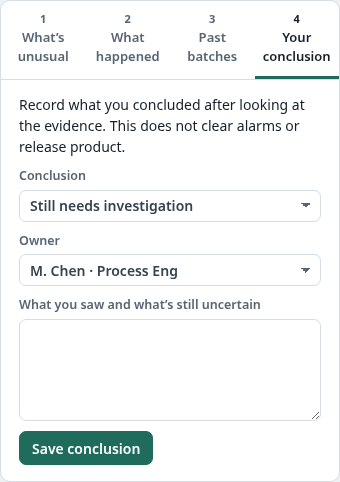 Investigation conclusion formClassify deviation, select owner and record evidence-backed review notes
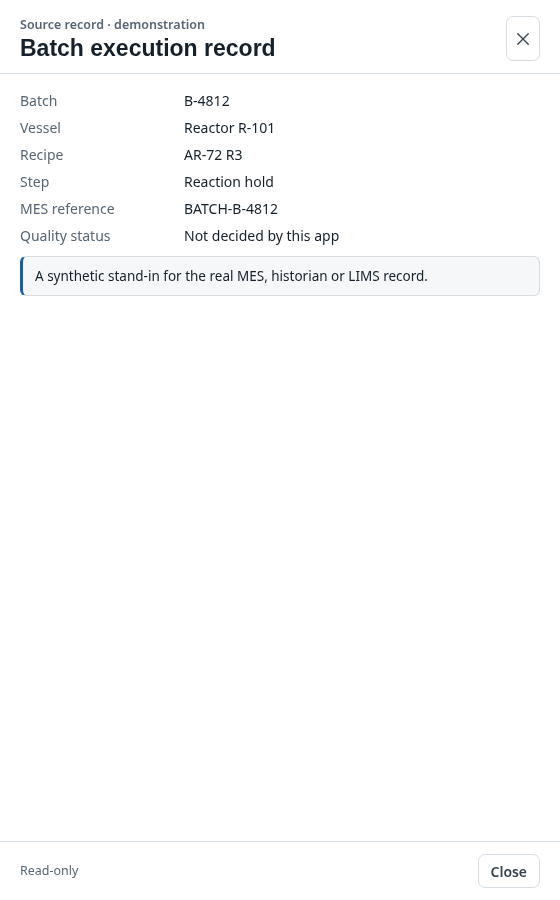 Source evidence detail drawerRead-only MES batch, historian, or LIMS evidence with timestamp and provenance
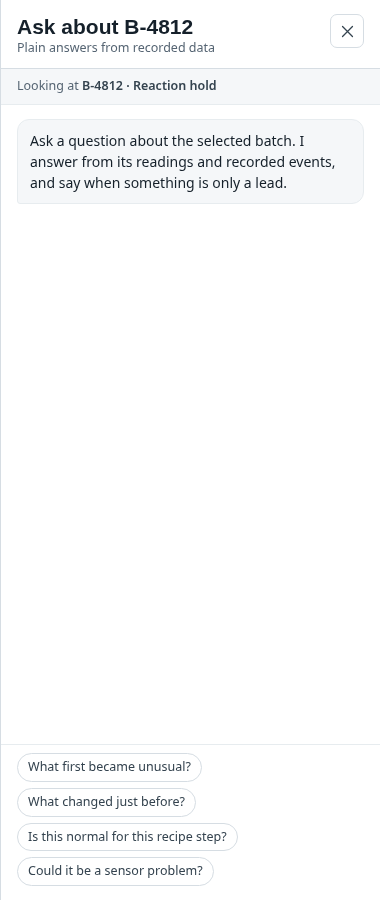 Contextual batch assistantExplain highlighted process trajectories, deviation signals and associated historian or batch events.
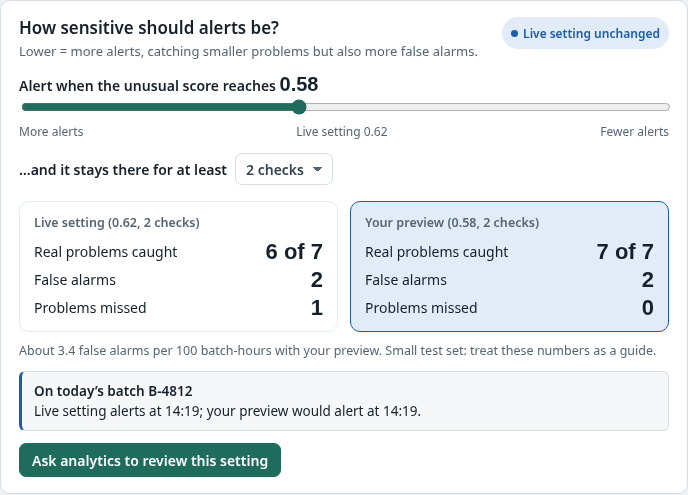 Alert sensitivity tuningReview threshold and persistence against live comparison and candidate settings
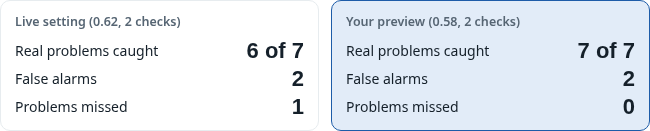 Holdout model evaluationReview caught cases, false positives and missed deviations for live versus candidate alert setting
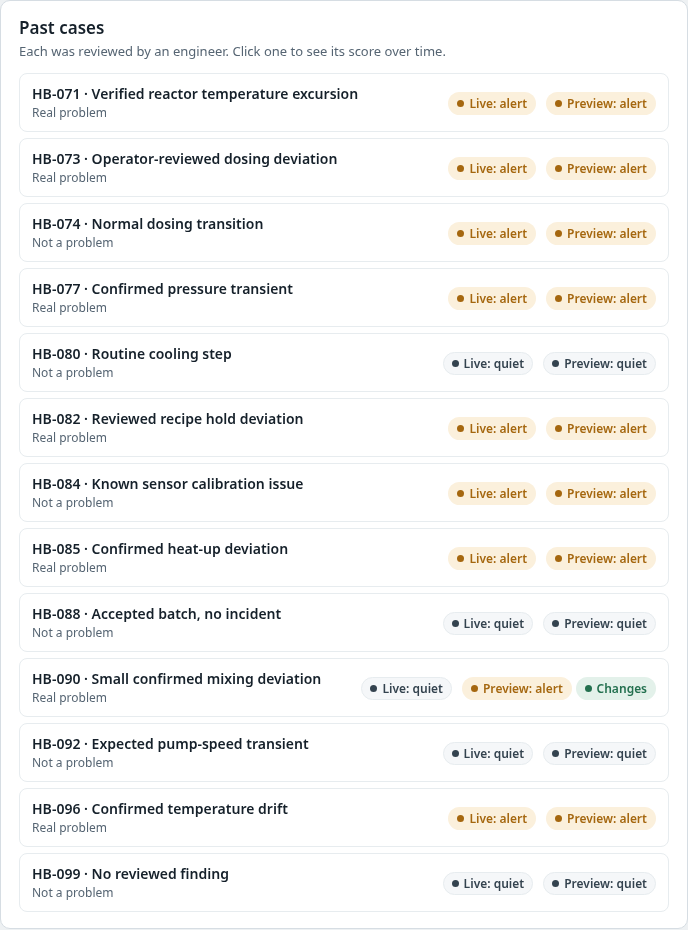 Historical alert case outcomesHuman-reviewed past episodes and whether candidate/live detector would have raised an alert
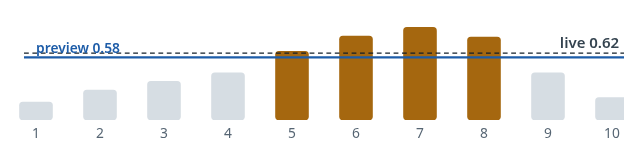 Expanded historical case score chartPer-window anomaly score chart with candidate threshold overlay for a selected historical case
 Data reliability heatmapPresence, latency and gaps across sensor streams and recent batches
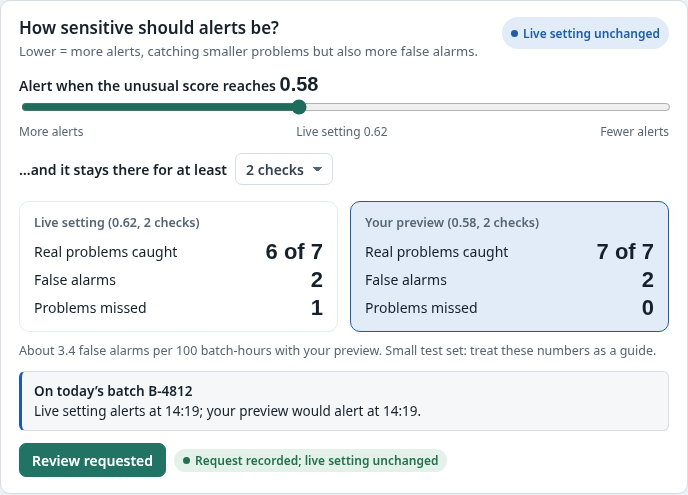 Alert setting review requestRequest analytics review while the live detector threshold remains unchanged
How people use it
- Choose batch and current phase
- Compare sensor lanes against matched accepted runs
- Inspect MES/DCS events, evidence and similar batches
- Document a conclusion with owner and note
- Evaluate candidate alert sensitivity without deployment
Data it works with
- Batch
- Vessel
- Recipe revision
- Phase
- Event time
- Temperature °C
- Pressure bar(a)
- Agitator power kW
- Jacket temperature °C
- Detector score
- Review classification
Start from this blueprint in your terminal.
Attach it to a project and your coding agent adapts it to your data, rules and roles.
Install the CLI- Sign in
vortexify login - Attach this blueprint
vortexify blueprints attach anomaly-detection-chemicals - Ask your agent to build it
Build the app from the attached blueprint using our data.
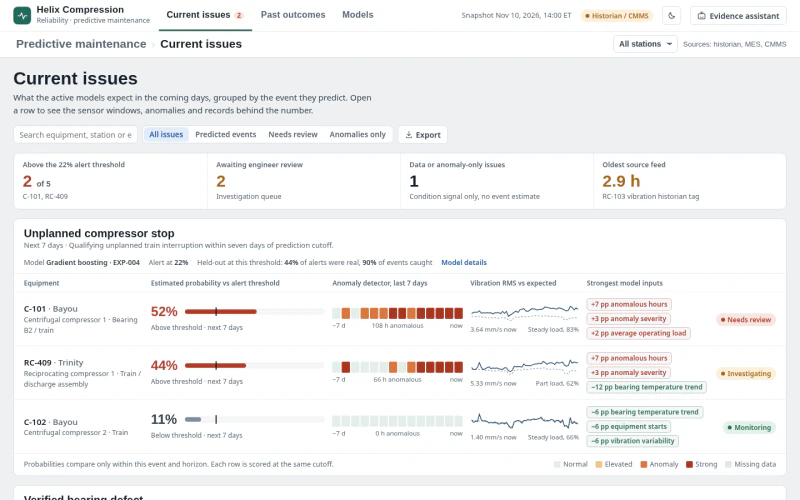 MESGas Compressor Predictive MaintenanceWhich compressor condition signals require review now, what evidence supports the prediction, and what intervention is justified?
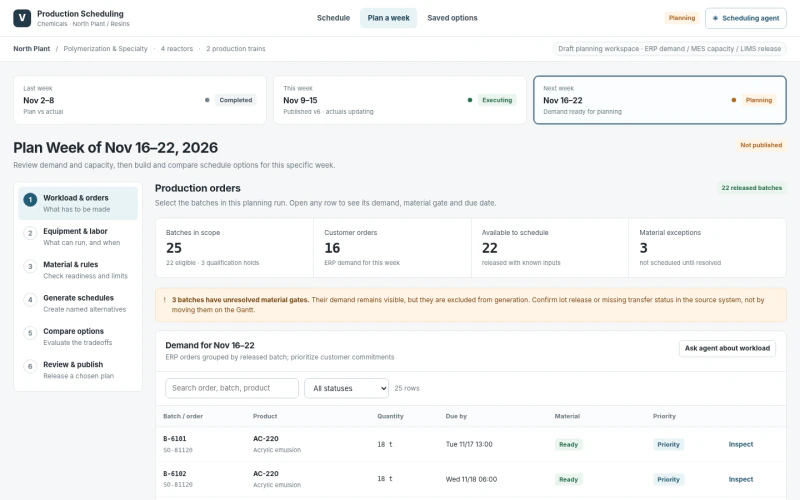 MESChemical Batch SequencingWhich feasible sequence minimizes late batches without hiding cleaning or eligibility constraints?
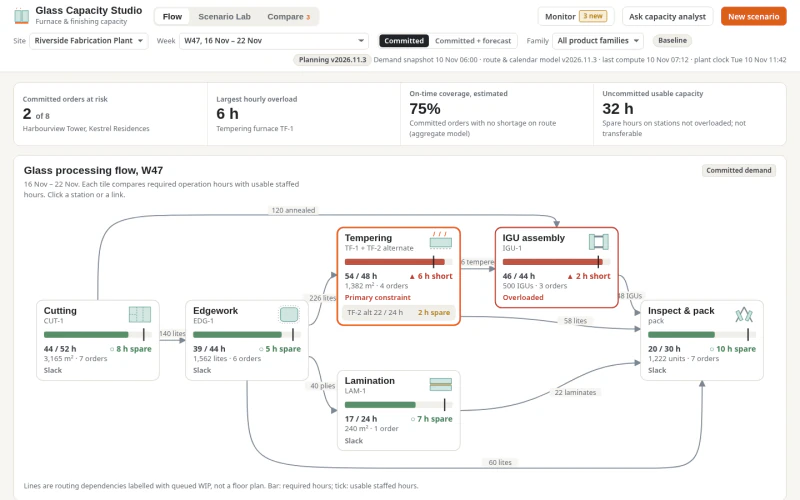 ERPGlass Production Capacity PlanningWhich fabrication stages and weeks are capacity-constrained, what work orders are exposed, and which feasible, qualified interventions recover committed service?